Molecular dynamics (MD) simulations are often used to investigate the properties of materials1, including as part of multiscale materials prediction applications2. Any measurement of a material property will have an associated error, the VECMAtk provides useful tools to evaluate these errors.
EasyVVUQ provides a means of generating and analysing ensembles of simulations from which we can estimate the confidence in the result that are draw. Running these ensembles obviously increases the cost of the study, so large computational resources are required for studies where uncertainty quantification is desired.
For example, well understood soft-matter system have been studied to show how calculations of Young’s modulus (YM) (stiffness) carried out using MD can vary significantly dependent on the size of the system and starting configuration.
The size of a simulation cell has many implications for computational cost and, more importantly, the scientific results it furnishes. Finite size effects, self-interaction across periodic boundary boundaries and thermal fluctuations in small systems can all affect the simulation’s outcome. The YM of an epoxy system was calculated by measuring the pressure exerted along one axis before and after a small strain. Since the instantaneous pressure calculated in MD simulations can fluctuate by several GPa, it is necessary to average these values over a long sample period to determine the change in pressure due to the applied strain. Calculated YM is also be affected by the starting velocities of the atoms in the system, and initial configuration of the epoxy network. To measure the system size dependence of all of these potential sources of variance, an EasyVVUQ Campaign was designed which takes samples across each variable. Then, bootstrap analyses used to calculate their effect on the YM. A closer look at the variance due to each variable shows which is the most significant. A large ensemble of 1800 unique tests was generated to sample across all these variables.
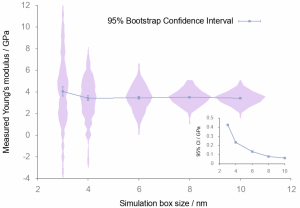
Fig. 1: Young’s modulus of an epoxy resin measured with different simulation sizes. Each point is the average of 300 simulations, which make up the pink histograms for each box size. The 95\% bootstrap confidence interval for each simulation size is shown clearly in the bottom right insert.
A summary of the results from the study are shown in the above Fig. 1. It can clearly see that the average YM is independent of simulation size, above 4 nm. There is approximately a 20\% increase in YM for a system size of 3 nm. It can safely be stated therefore that for this system the characteristic length is therefore less than 4 nm.
[1] Vassaux M, Sinclair R.C., Richardson R.A., Suter, J.L., Coveney P.V., Towards High Fidelity Materials Property Prediction from Multiscale Modeling and Simulations, Adv Theory Simulations. 2020 Jan 4; 3(1):1900122. Available from: https://onlinelibrary.wiley.com/doi/abs/10.1002/adts.201900122 [2] Vassaux M, Richardson R.A., Coveney P.V., The Heterogeneous Multiscale Method Applied to Inelastic Polymer Mechanics. Philos Trans R Soc Math Phys Eng Sci. 2019:377(2142)